
A BMR calculator estimates your basal metabolic rate: the calories your body would burn in a day if you did nothing but stay alive, lying still, awake, and warm. For most adults that quiet, background burn is the single biggest slice of daily energy use, which is why nearly every calorie plan starts with it. It’s also one of the most misunderstood numbers in weight management. It isn’t a calorie target, it isn’t a floor you must eat above, and it isn’t fixed for life.
This guide explains what the number measures, what pushes it up or down, how to work out BMR by hand in pounds and inches with three well-known equations, and how far you can trust the result. You’ll also see how measured BMR differs from an estimate, what the research says about muscle, aging, and dieting, and who should skip the calculator and talk with a clinician instead.
BMR is only one piece of a bigger picture. To turn it into a full-day estimate, see our TDEE calculator guide; for the step-by-step math of a deficit, see how to calculate a calorie deficit. The parent guide, how to lose weight safely, puts all of it in context. This article is educational and general. It can’t predict how much weight you’ll lose, and it isn’t a substitute for advice from your own clinician.
Key Takeaways
Here’s the short version. Each point is explained, with sources, in the sections that follow.
What BMR is and what a calculator gives you
The number in plain English
- BMR is the energy your body uses at complete rest to run the brain, heart, liver, kidneys, lungs, and the constant upkeep of tissues. It does not include walking, workouts, chores, or the energy of digesting food.
- A calculator estimates BMR from a formula that uses your weight, height, age, and sex (or your lean mass, if you provide body fat). The output is a prediction for people like you, not a measurement of you.
- Among the common equations, Mifflin-St Jeor has the best track record in a systematic review of resting-rate equations, but the same review warns that errors for individual people can still be noteworthy.
What the number is not
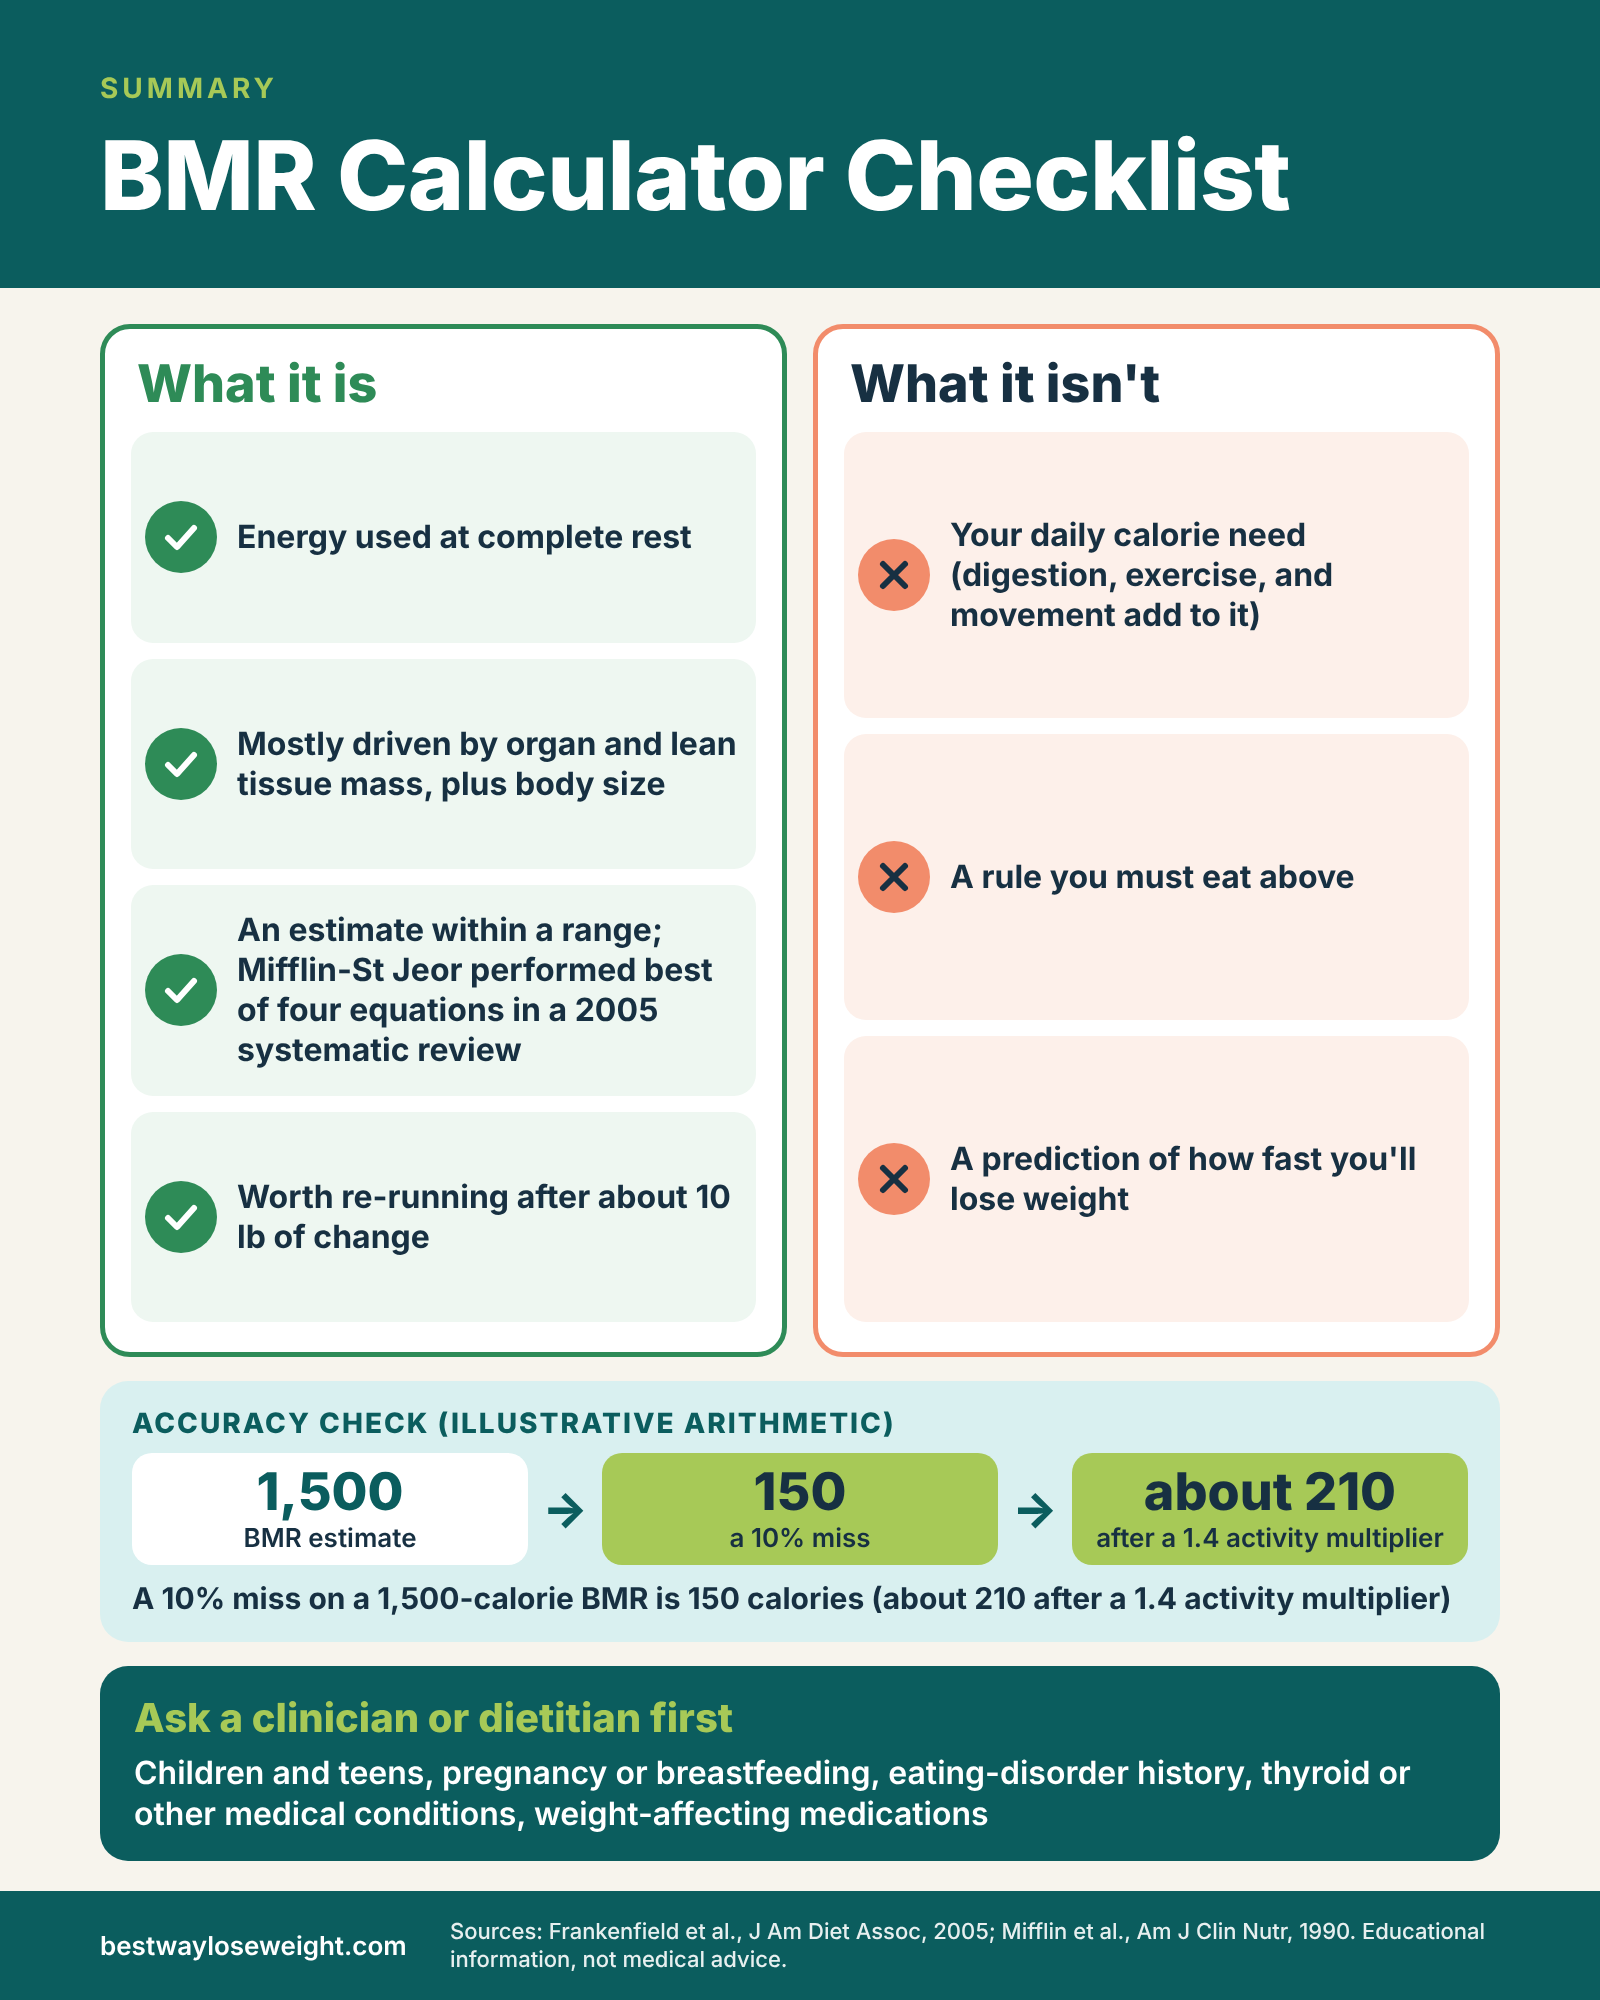
- BMR is not your daily calorie need. Total daily needs also include food digestion, exercise, and everyday movement, so they’re higher. The TDEE guide linked above covers that full number.
- BMR is not a magic cutoff. Eating a little below a calculated BMR for a short time isn’t automatically dangerous, and eating above it isn’t automatically safe. What matters is the full picture, how long, and who you are.
- BMR is not “slow” or “fast” in the way social media suggests. Bigger bodies and more lean tissue generally mean a higher BMR, and the differences between similar people are smaller than most myths imply.
How to use it well
Treat it as a starting range
- Run two equations and treat the gap between them as a range. If they land within about 100 to 150 calories of each other, the number is probably a reasonable starting point.
- Re-run the calculator after meaningful changes in weight (roughly 10 pounds or more) because BMR moves with body size.
Know when to skip it
- Calculators are not designed for children and teens, pregnancy or breastfeeding, people with a history of an eating disorder, or people whose energy use is shaped by a medical condition or medication. In those cases, a clinician or registered dietitian should guide calorie targets.
- Measured BMR (indirect calorimetry) exists but is rarely necessary; a handheld device tested in one study didn’t agree well enough with the lab standard to be used as a substitute.
What a BMR Calculator Estimates (and What BMR Actually Means)
Before running any formula, it helps to know exactly what the formula is trying to predict. “Metabolism” is a loose word that gets used for everything from digestion to energy levels to how easily someone gains weight. Basal metabolic rate is much narrower. It’s a specific, measurable quantity, and keeping it narrow is the first step to using it sensibly.
BMR in plain English
The “lights on, nobody home” definition
Think of a parked car with the engine idling. It isn’t going anywhere, but it still burns fuel to keep the engine turning and the electronics running. Your body does the same. Even at complete rest, it spends energy on pumping blood, breathing, filtering waste through the kidneys, keeping the brain active, holding body temperature near 98.6°F (37°C), and continually rebuilding proteins and other tissue. Basal metabolic rate is the energy cost of those jobs, usually expressed as calories per day (technically kilocalories, or kcal, which is what a food label calls a Calorie).
The strict laboratory definition is demanding: measured shortly after waking, after a night of sleep and many hours without food, lying still in a comfortable room, with no recent exercise, caffeine, or nicotine. That’s difficult to arrange outside a research setting, so the number most people actually get from a calculator is better thought of as a typical resting value.
BMR, RMR, and REE: the vocabulary you’ll run into
You’ll see three overlapping terms. BMR (basal metabolic rate) is the strict version just described. RMR (resting metabolic rate) and REE (resting energy expenditure) are measured under slightly looser conditions, such as after a shorter fast and a period of quiet rest, and they usually come out a little higher than a true BMR. In everyday use, including in most online calculators, the terms are treated as interchangeable. The research on measurement, which we’ll draw on later, mostly uses RMR.
| Term | What it means | What it includes | What it leaves out |
|---|---|---|---|
| BMR (basal metabolic rate) | Energy used at complete rest under strict conditions | Organ function, breathing, circulation, temperature, tissue upkeep | Digestion, movement, exercise |
| RMR / REE (resting metabolic rate / resting energy expenditure) | Energy used at rest under looser, practical conditions | Same as BMR, measured after a shorter fast and rest | Digestion (if fasted), movement, exercise |
| TDEE (total daily energy expenditure) | All calories burned in a typical day | BMR/RMR plus digestion, exercise, and everyday movement | Nothing; it is the whole-day total |
| “Maintenance calories” | Calorie intake at which weight stays stable over time | Roughly equal to TDEE | Not a fixed number; shifts with weight and routine |
What a BMR calculator actually does
The inputs and the output
Nearly every online BMR calculator asks for the same four things: weight, height, age, and sex. Some add body fat percentage. Behind the screen sits a prediction equation, a formula built by measuring the resting energy use of groups of people and finding the mathematical relationship that best predicts it from simple body measurements. You enter your numbers, the formula returns one figure, and the page labels it your BMR.
That figure is a prediction for the “average” person with your measurements. Real people differ from the average in ways a four-input formula can’t see: how much of your weight is muscle versus fat, the size of your organs, your thyroid status, even recent changes in your weight. This is why the same person can get answers that differ by a hundred calories or more from two different calculators.
What the output is good for
Used sensibly, the number does three useful jobs. It sets a reasonable starting point for a calorie plan once you add activity. It gives you a way to sanity-check a plan, such as noticing that a 1,000-calorie target is far below anything your body would use even at rest. And it helps you see why your needs change: lose weight, and BMR falls a bit; build lean mass, and it rises a bit. What it can’t do is tell you how fast you’ll lose weight, whether your metabolism is “broken,” or exactly how many calories to eat.
What Drives Your Basal Metabolic Rate
If BMR is the cost of keeping your systems running, then the main question is simple: which parts of the body are doing the most work at rest? The answer surprises many people. A small group of organs does a lot of the spending, while muscle and fat, the tissues people think about most, are comparatively modest.
Organs and tissues: where resting energy goes
The high-spending organs
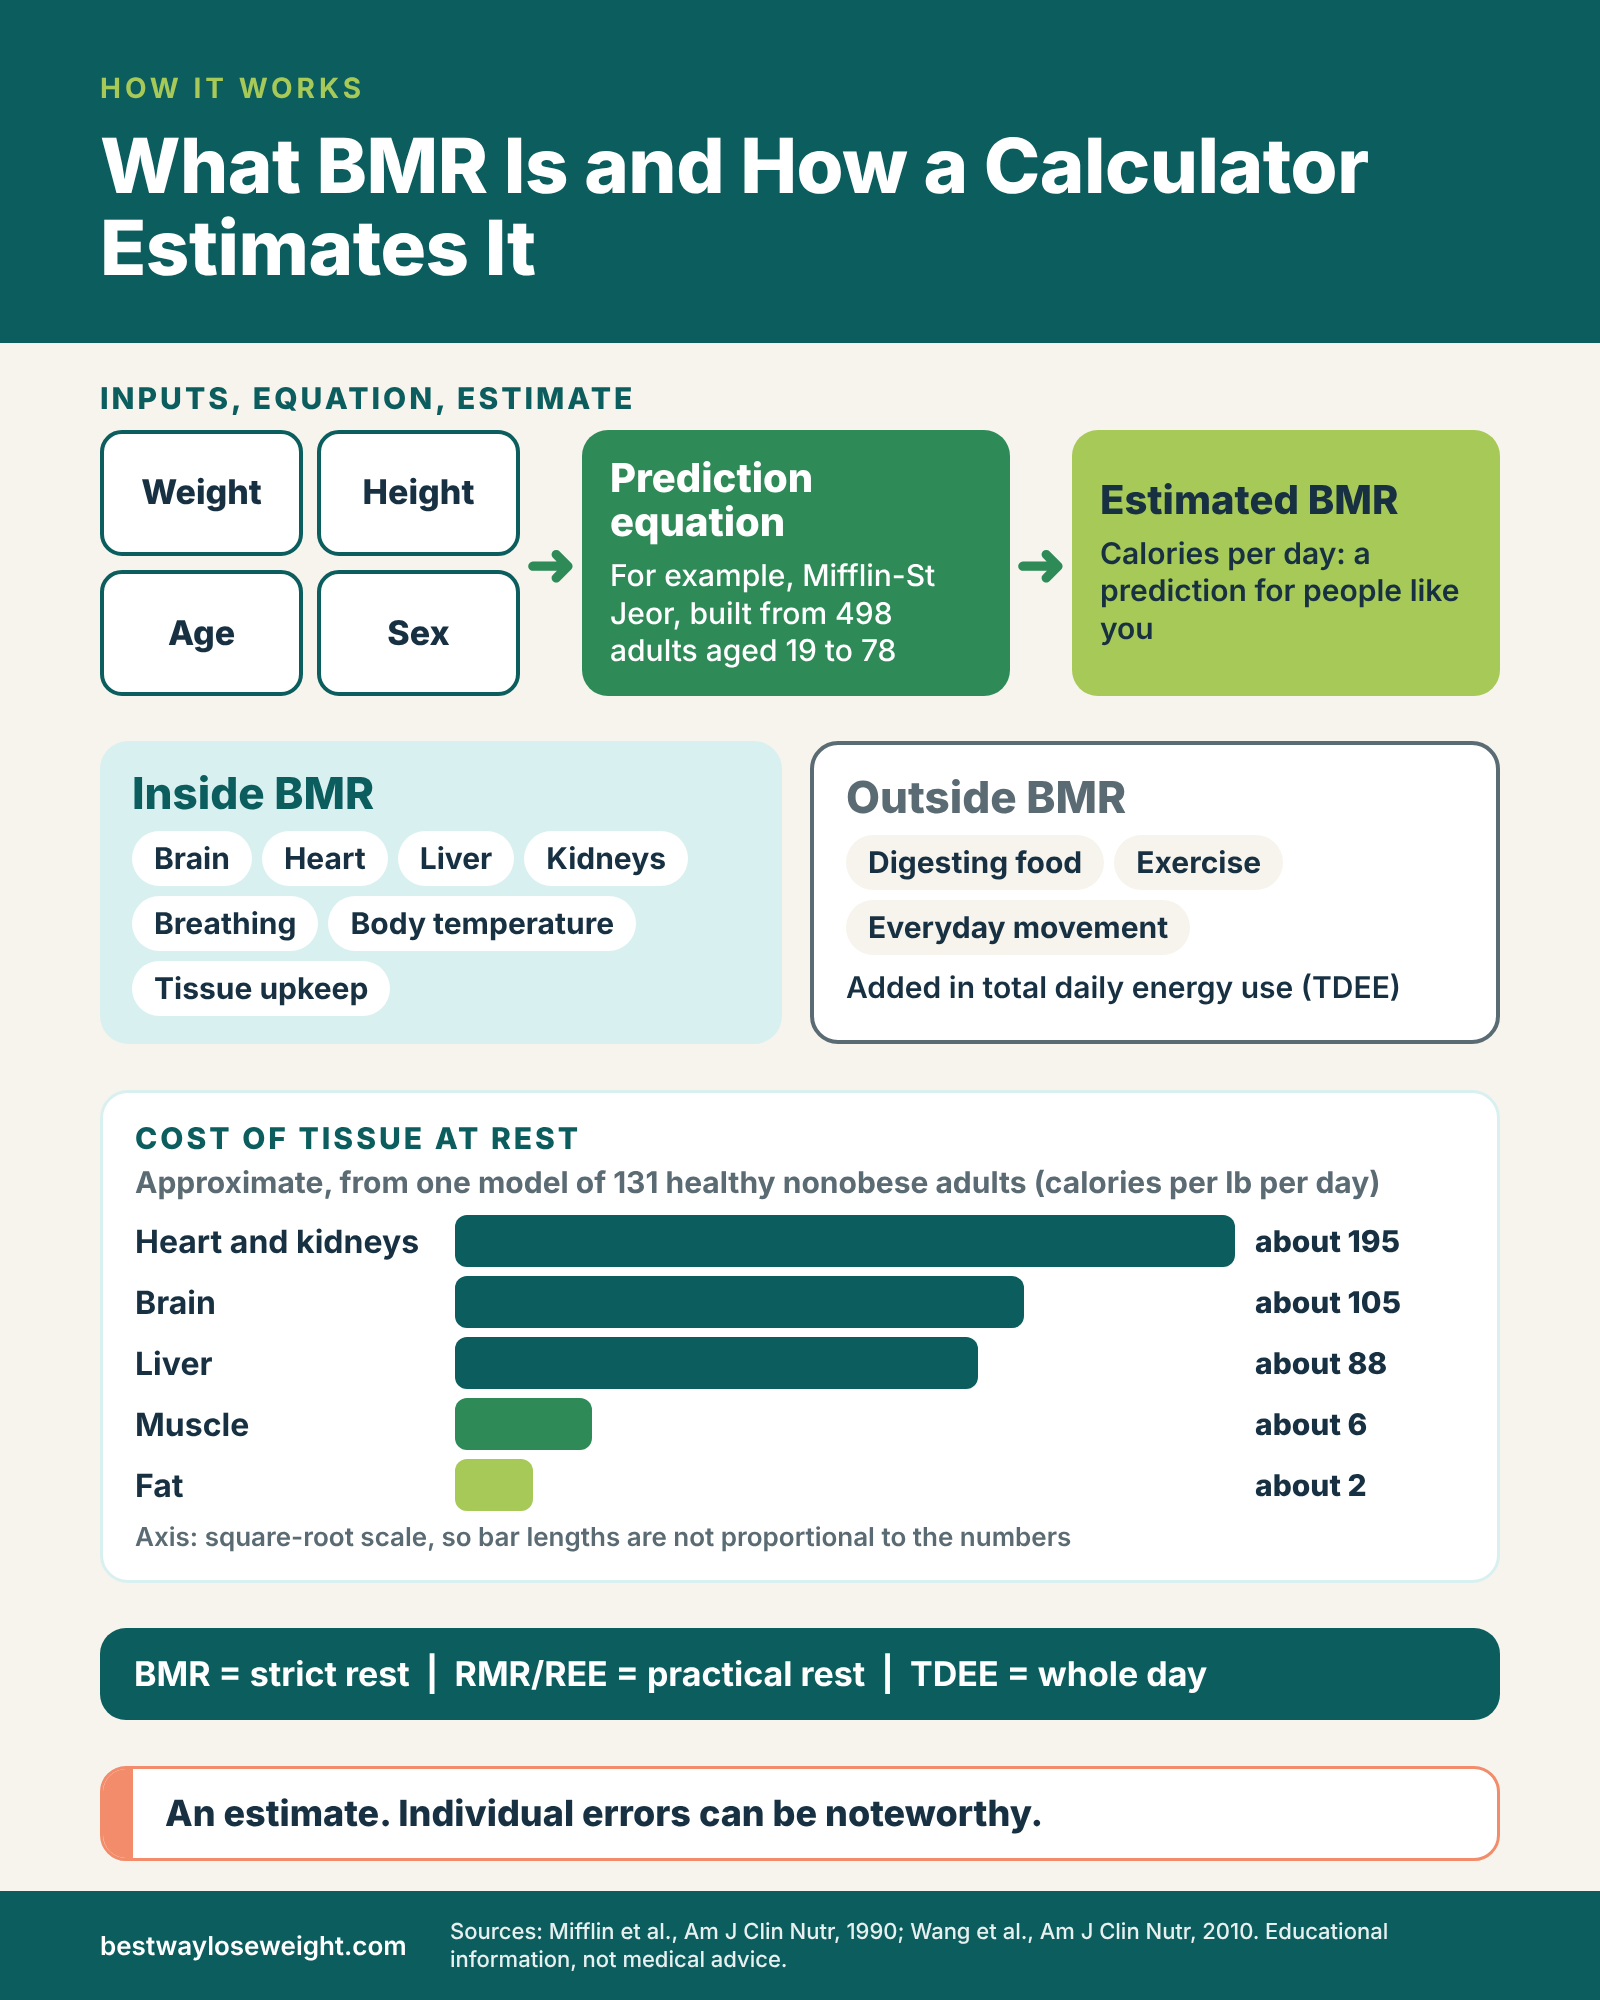
A research team led by Z. Wang built a model of resting energy expenditure from MRI scans of organ and tissue size and indirect calorimetry in 131 healthy, nonobese adults (American Journal of Clinical Nutrition, 2010). In that work, the brain, liver, heart, and kidneys had by far the highest energy cost per unit of weight. Using the model’s age-adjusted values as summarized in a public database, these organs run on the order of 200 to 430 calories per kilogram of tissue per day (roughly 90 to 195 calories per pound).
These organs are small, so their total share of the body’s weight is modest, but their share of resting energy is large. That’s the key idea: a body doesn’t burn calories at rest in proportion to its weight, but in proportion to what the tissues are doing.
Muscle and fat at rest
By contrast, the same model put skeletal muscle at only about 13 calories per kilogram per day (about 6 per pound) and fat tissue at about 4 to 5 calories per kilogram (about 2 per pound). Muscle uses roughly three times as much energy at rest as fat does, which is real, but the absolute amounts are small. Gaining 5 pounds of muscle, on this model’s numbers, adds only around 30 calories a day at rest.
| Organ or tissue | Approx. calories per kg | Approx. calories per lb | What this means in practice |
|---|---|---|---|
| Heart and kidneys | about 430 | about 195 | Highest cost per unit weight; small organs |
| Brain | about 230 | about 105 | Roughly constant use; runs day and night |
| Liver | about 195 | about 88 | Large chemical workload; sensitive to illness and fasting |
| Skeletal muscle | about 13 | about 6 | Low cost per pound at rest, but a lot of pounds |
| Fat tissue | about 4 to 5 | about 2 | Lowest cost per pound at rest |
| Residual mass (bone, skin, other) | about 12 | about 5 | Everything not counted above |
These values come from a model fitted to a limited sample, and individual organ sizes vary, so treat them as approximate. We read them from a public database summary of the paper, not the paper itself.
Body size and body composition
Fat-free mass is the biggest single predictor
Fat-free mass is everything in your body that isn’t fat: muscle, organs, bone, and water. In the 1990 study that produced the Mifflin-St Jeor equation, fat-free mass was the strongest single predictor of resting energy expenditure, ahead of body weight alone. That finding is why equations that use lean mass, such as the Katch-McArdle formula, can be more accurate when you have a trustworthy body fat estimate.
It also explains why two people with the same weight can have different BMRs. If one carries more muscle and organ mass and the other carries more fat, the first will generally burn more at rest. The difference is usually measured in tens of calories, sometimes low hundreds at the extremes, not in the thousands that supplement ads imply.
Why larger bodies have a higher BMR
A common misunderstanding is that people with obesity have a “slow metabolism.” In absolute terms the opposite is typically true: a larger body has more tissue to maintain, including more fat-free mass, so its resting energy use is usually higher than that of a smaller person. The equations reflect this directly. In every common formula, weight has a positive coefficient, so a heavier person gets a higher predicted BMR.
This has a practical consequence. As weight falls, BMR falls too, because there’s less tissue to maintain. That’s one reason a calorie target that worked at the start of a weight-loss effort often needs revisiting later, a point we return to in the section on metabolic adaptation.
Age, sex, and the “metabolism slows in your 40s” idea
What the formulas assume about age
Every common equation subtracts calories for each year of age. In Mifflin-St Jeor, it’s 5 calories per year, so a 10-year age difference means about 50 calories a day. That’s a modest effect, and it reflects the tendency for lean mass to decline gradually with age in many adults, especially when strength training and protein intake are low.
What newer research says about mid-life
Many people believe that metabolism falls off a cliff around 40. A large study in Science (Pontzer et al., 2021) analyzed doubly labeled water measurements, a method that tracks total daily energy use in free-living people, across ages from days-old infants to 95-year-olds. Once the researchers adjusted for fat-free mass, energy expenditure stayed stable from about age 20 to about age 60 and began to decline after about 60. The finding doesn’t mean no one’s metabolism changes in midlife; it means age alone, between 20 and 60, may explain less than the popular story suggests, and that changes in muscle, activity, and habits likely matter more. That study measured total energy expenditure rather than BMR specifically, so it informs but doesn’t settle questions about resting rate alone. Our guide to weight loss after 40 covers what does shift in midlife.
Sex differences
Equations add a constant for men and subtract one for women. In Mifflin-St Jeor, that’s +5 versus −161, a gap of 166 calories a day for the same weight, height, and age. Much of this gap reflects the average difference in lean mass and body size between men and women, not an inherent biological “advantage.” An individual woman with a lot of muscle can have a higher BMR than an individual man with little.
Hormones, health, and illness
Thyroid hormones
The National Institute of Diabetes and Digestive and Kidney Diseases (NIDDK) states that thyroid hormones control the way the body uses energy, and that without enough of them, many body functions slow down. Weight gain is among the listed symptoms of an underactive thyroid, but NIDDK adds that symptoms such as fatigue and weight gain are common and don’t necessarily mean a thyroid problem. If you have persistent fatigue, feeling cold, unexpected weight changes, or a family history of thyroid disease, that’s a conversation for a clinician, not something a BMR calculator can answer.
The menstrual cycle
A 2020 systematic review and meta-analysis in PLOS ONE (Benton et al.) pooled 26 studies involving 318 women and found a small but statistically significant tendency for resting metabolic rate to be higher in the luteal phase (the second half of the cycle, after ovulation) than in the follicular phase (the first half). The authors noted that when only studies published since 2000 were analyzed, the effect shrank and was no longer statistically significant. The practical takeaway is that a cycle-related wobble may exist, but it’s small compared with the error in any calculator, and it doesn’t justify changing a plan from week to week.
Illness, medications, and other influences
Fever raises resting energy use, and some medications and medical conditions can raise or lower it. We don’t give specifics here because they vary by drug and person, and no calculator accounts for them. If you take medication that your clinician has linked to appetite or weight changes, ask how it affects your energy needs rather than assuming a standard formula applies. Never stop or change a prescription because of a calculator result.
BMR Formulas You Can Do by Hand: Mifflin-St Jeor, Harris-Benedict, and Katch-McArdle
You don’t need a website to estimate BMR. The three best-known equations fit on an index card, and working one through once shows you exactly what the calculator is doing and which inputs matter most. We use pounds and inches throughout, with metric versions where they help. All the arithmetic below is ours and is meant to illustrate the formulas, not to measure anyone’s metabolism.
Mifflin-St Jeor: the usual default
The formula in metric units
Published in 1990 by Mifflin, St Jeor, and colleagues in the American Journal of Clinical Nutrition, this equation was built from resting energy measurements in 498 healthy adults aged 19 to 78. The authors reported that fat-free mass was the strongest single predictor of resting energy expenditure, and that the Harris-Benedict equations derived in 1919 overestimated measured values by 5% in their comparison. In metric units the formula is:
- Men: BMR = (10 × weight in kg) + (6.25 × height in cm) − (5 × age in years) + 5
- Women: BMR = (10 × weight in kg) + (6.25 × height in cm) − (5 × age in years) − 161
The formula in pounds and inches
Converting the coefficients (1 lb = 0.4536 kg; 1 inch = 2.54 cm) gives a version you can use without any unit conversion:
- Men: BMR = (4.536 × weight in lb) + (15.875 × height in inches) − (5 × age) + 5
- Women: BMR = (4.536 × weight in lb) + (15.875 × height in inches) − (5 × age) − 161
Here’s how to work it, using an illustrative woman we’ll call Maria: 38 years old, 5 feet 5 inches (65 inches), 170 pounds.
- Weight term: 4.536 × 170 = 771.1
- Height term: 15.875 × 65 = 1,031.9
- Add them: 771.1 + 1,031.9 = 1,803.0
- Subtract the age term: 5 × 38 = 190, so 1,803.0 − 190 = 1,613.0
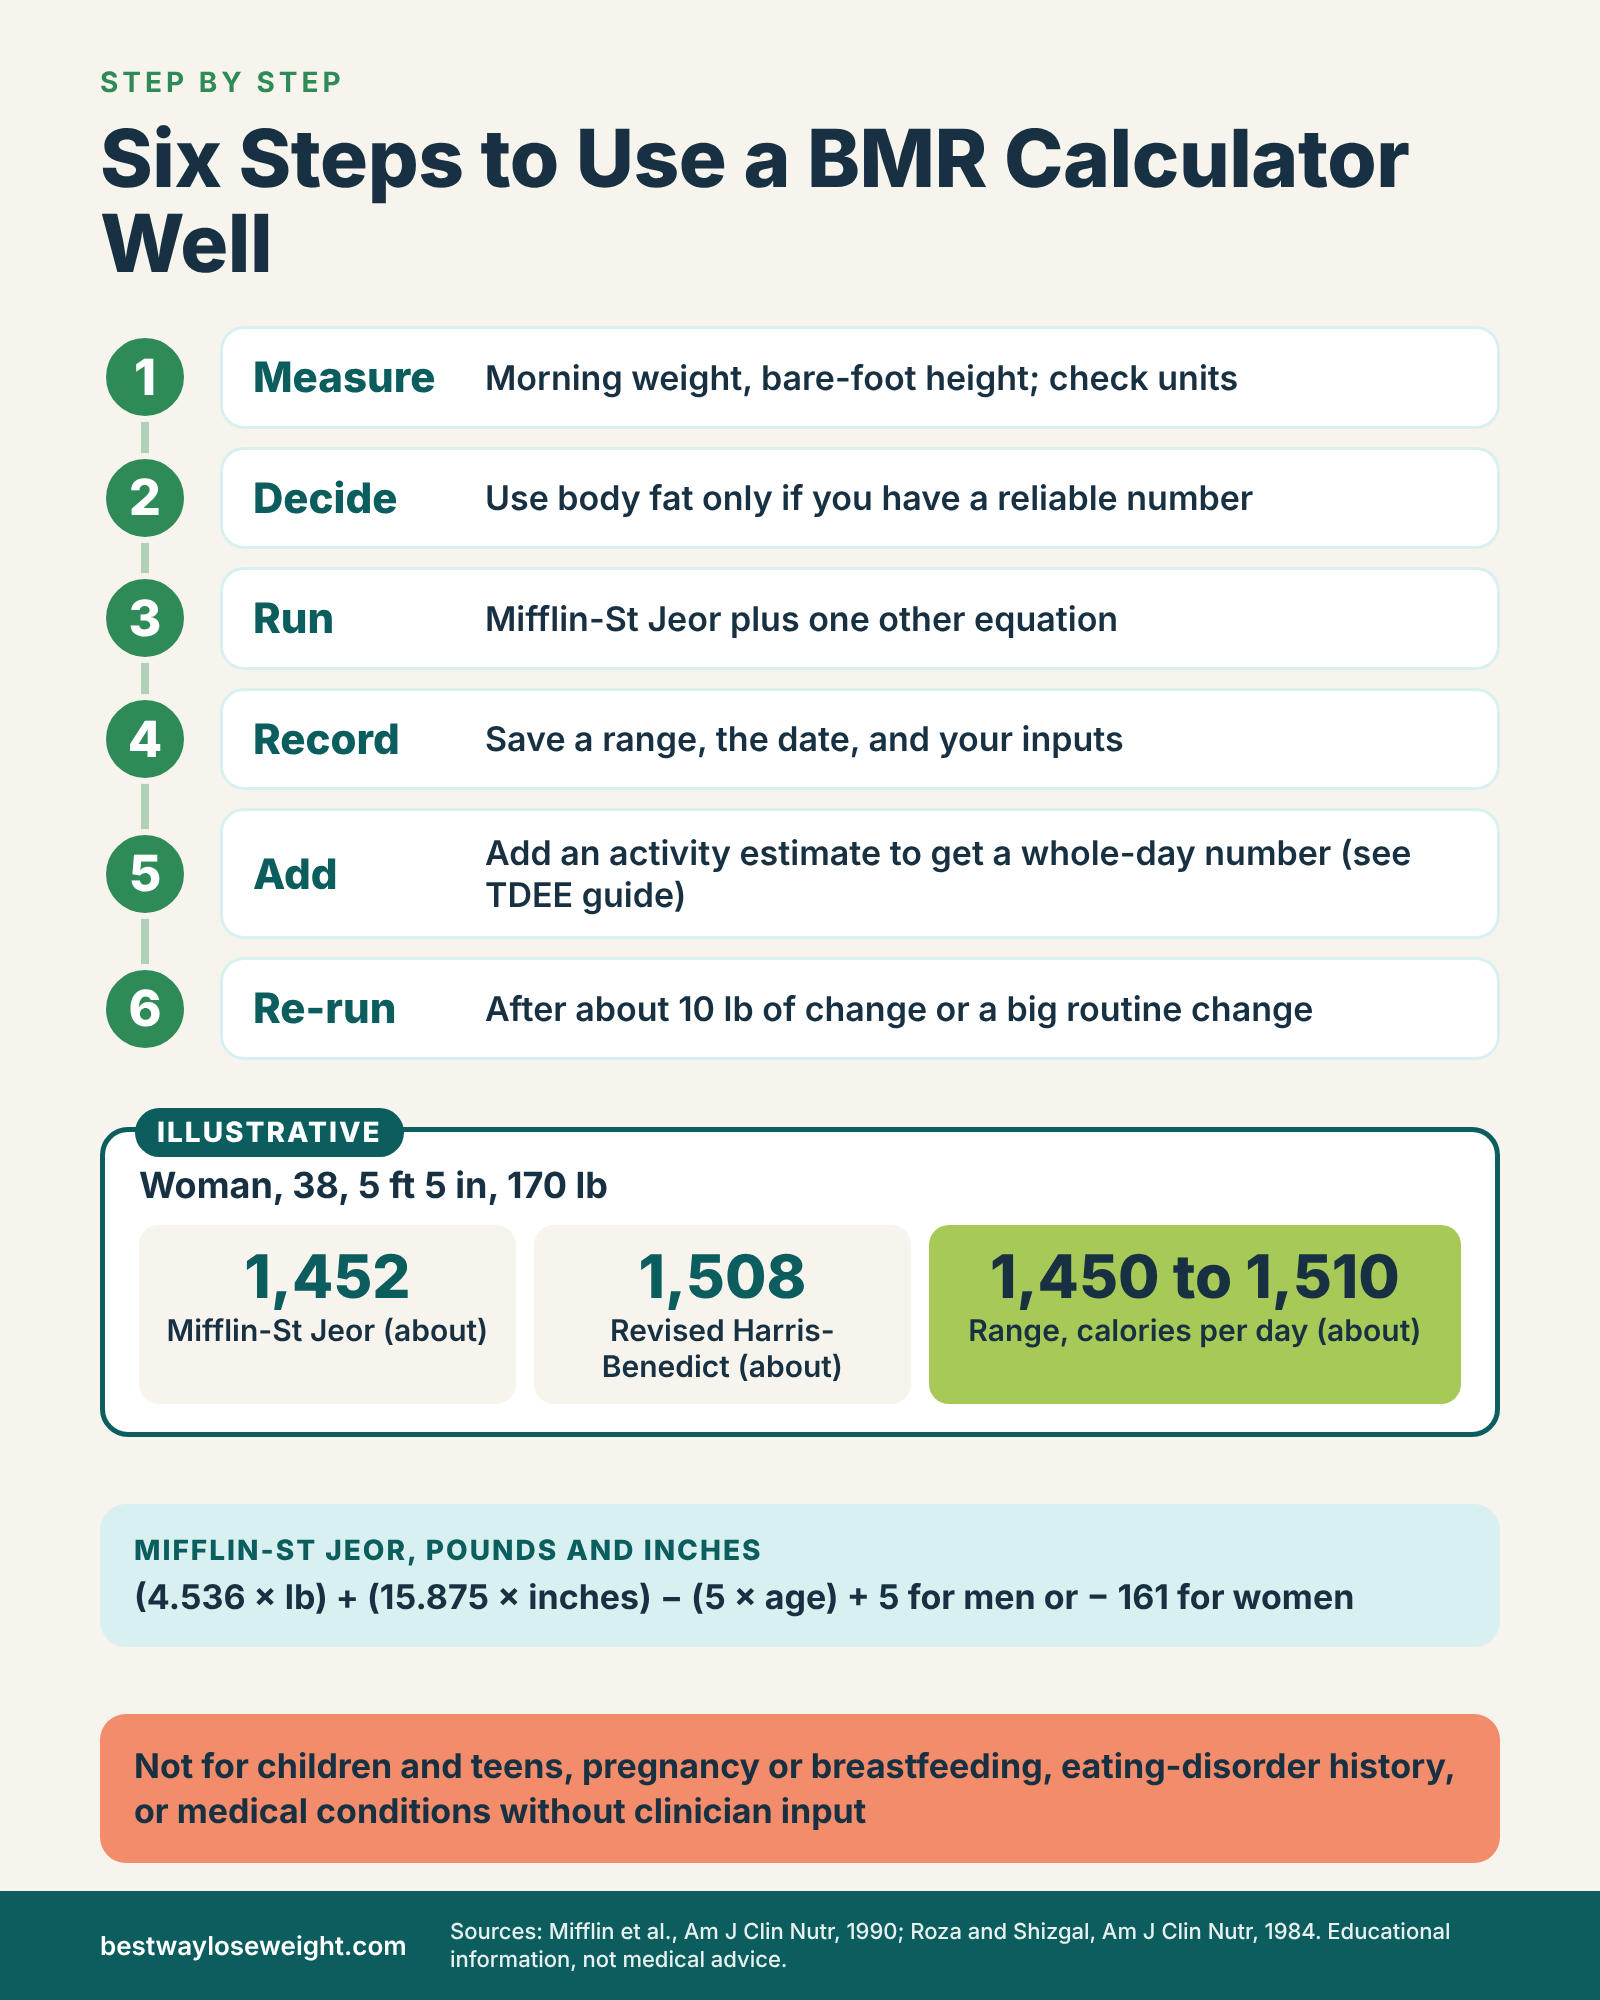
- Apply the sex constant for women: 1,613.0 − 161 = about 1,452 calories per day
Revised Harris-Benedict: the older standard
The formula
The Harris-Benedict equations date back to 1919 and were revised in 1984 by Roza and Shizgal. The revised version appears in many calculators and textbooks. We confirmed its coefficients against a secondary reference rather than the original paper, so treat these values as widely published but not independently verified by us. In pounds and inches, they’re:
- Men: BMR = 88.362 + (6.077 × weight in lb) + (12.19 × height in inches) − (5.677 × age)
- Women: BMR = 447.593 + (4.195 × weight in lb) + (7.869 × height in inches) − (4.330 × age)
For Maria: 447.593 + (4.195 × 170 = 713.2) + (7.869 × 65 = 511.5) − (4.330 × 38 = 164.5) = about 1,508 calories per day.
Why it tends to run higher
In the 1990 Mifflin-St Jeor study, the original 1919 Harris-Benedict equations overestimated measured resting energy by 5%. The 1984 revision changed the coefficients, and we haven’t seen a head-to-head comparison that we can cite for it. What we can say from our own arithmetic is that the revised version comes out above Mifflin-St Jeor for every person in this article. For Maria the difference is 56 calories, and for the older and heavier people in the profiles below, it’s larger. If you see a gap like that between two calculators, it’s usually this: different equations, not a different body.
Katch-McArdle: the lean-mass equation
The formula
Katch-McArdle skips height, age, and sex, and instead uses lean body mass: your weight minus your estimated fat mass.
- BMR = 370 + (21.6 × lean body mass in kg)
The coefficients are as commonly published; we cross-checked them against a secondary worked example but did not find them in a primary source we could open, so they are flagged for verification. To use the formula, first convert weight to kilograms, then subtract fat mass. Maria weighs 170 lb, which is 77.1 kg. If her body fat is 38%, her lean mass is 77.1 × 0.62 = 47.8 kg, and BMR = 370 + (21.6 × 47.8) = about 1,403 calories per day.
The body-fat input problem
Katch-McArdle is only as good as the body fat percentage you feed it, and body fat estimates from bathroom scales, handheld devices, and skinfold calipers can be off by several percentage points. A few points of error matters more than people expect, as the sensitivity table later shows. In practice, if you don’t have a reasonably reliable body composition measurement, the weight-height-age-sex equations are the safer choice.
Which equation should you use?
A sensible default
For most adults without a trustworthy body-composition measurement, Mifflin-St Jeor is a solid starting point. A systematic review of resting-rate equations in healthy nonobese and obese adults (Frankenfield, Roth-Yousey, and Compher, Journal of the American Dietetic Association, 2005) found that Mifflin-St Jeor predicted resting metabolic rate within 10% of the measured value in more people than any of the other three commonly used equations it examined, and had the narrowest error range. The same review cautioned that noteworthy errors exist when equations are applied to individuals, and that older adults and U.S. ethnic minority groups were underrepresented in the data used to develop and validate them.
When a different equation makes sense
If you have a recent, reliable body-composition scan, Katch-McArdle gives you a second opinion that accounts for muscle. If you’re comparing your result with an older textbook or an app that uses Harris-Benedict, expect it to read a bit higher. If your measurements fall in a group the equations weren’t built for (very muscular, very tall or short, children, pregnancy), no formula is ideal and the right move is professional guidance.
| Equation | Inputs | Maria’s result (calories/day) | Strength | Main caution |
|---|---|---|---|---|
| Mifflin-St Jeor (1990) | Weight, height, age, sex | about 1,452 | Best-performing of four common equations in a 2005 systematic review | Individual error can be noteworthy; some groups underrepresented |
| Revised Harris-Benedict (1984) | Weight, height, age, sex | about 1,508 | Familiar; appears in many apps and textbooks | The 1919 original read 5% above measured values in the 1990 study; the revised version reads higher than Mifflin in our examples |
| Katch-McArdle | Lean body mass (needs a body fat estimate) | about 1,403 at 38% body fat | Accounts for muscle and fat differences | Only as accurate as the body fat number you supply |
Worked Examples: Three People, Three Different BMRs
Numbers are easier to understand when you see them next to a real-looking person. The three profiles below are illustrative, not drawn from any study or patient. They show how weight, height, age, and sex combine, and how much the two weight-height-age-sex equations disagree.
Three illustrative profiles
Maria: 38, woman, 5 ft 5 in, 170 lb
We worked her number above: about 1,452 calories with Mifflin-St Jeor and 1,508 with revised Harris-Benedict, a gap of 56. If she were to treat the midpoint, around 1,480, as her working estimate, she’d be within roughly 30 calories of either equation. That’s more precision than the method really supports, but it shows how a range is better than a single number.
Tom: 52, man, 5 ft 10 in, 230 lb
Mifflin-St Jeor: (4.536 × 230 = 1,043.3) + (15.875 × 70 = 1,111.3) − (5 × 52 = 260) + 5 = about 1,900. Revised Harris-Benedict: 88.362 + (6.077 × 230 = 1,397.7) + (12.19 × 70 = 853.3) − (5.677 × 52 = 295.2) = about 2,044. The gap is 144 calories, larger than Maria’s, because Harris-Benedict gives more weight to body mass at higher weights. A person in Tom’s position who wants a single working figure might use the lower equation as the default and the higher one as the upper limit of the plausible range.
Linda: 67, woman, 5 ft 3 in, 140 lb
Mifflin-St Jeor: (4.536 × 140 = 635.0) + (15.875 × 63 = 1,000.1) − (5 × 67 = 335) − 161 = about 1,139. Revised Harris-Benedict: 447.593 + (4.195 × 140 = 587.3) + (7.869 × 63 = 495.8) − (4.330 × 67 = 290.1) = about 1,240. The gap is about 101 calories. Linda is also in the age group where the evidence base is thinner, which is a reminder that for older adults the calculator’s number is a particularly rough guess. Our guides on weight loss after 50 and menopause and weight gain discuss what else changes at these life stages.
Reading two equations side by side
What the gap tells you
In all three profiles, Harris-Benedict landed 56 to 144 calories above Mifflin-St Jeor. A gap of that size is within the normal noise of the method. It doesn’t mean one calculator is “wrong.” It means that anyone who needs a more precise number has to test it against real life, because a formula can’t narrow the range any further.
What to do with a range
A practical rule is to carry the range, not a point. Write down both numbers, plan around the lower one if you’re building a conservative calorie target, and treat the higher as a ceiling. Then check your assumptions against what actually happens to your weight over several weeks. The approach for doing that, using your own food and weight records, is covered in the TDEE guide.
How each input moves the number
Weight and height
In Mifflin-St Jeor, each pound adds about 4.5 calories a day and each inch of height adds about 16. So a 20-pound weight loss lowers the estimate by roughly 91 calories (20 × 4.536). Maria at 150 pounds, with everything else unchanged, comes out near 1,361 calories rather than 1,452. Height works the other way: Maria at 62 inches would be about 1,404, and at 68 inches about 1,500. These are modest swings, which is why a fixed BMR “number” from last year is often still in the right neighborhood.
Age and sex
Each year adds a 5-calorie subtraction, so ten years makes a difference of 50 calories per day. Sex changes the constant by 166. If you gave Maria’s measurements to the male version of the formula, you’d get about 1,618 calories rather than 1,452. The table below shows how weight and age interact for a woman 5 feet 5 inches tall. For a man of the same weight, height, and age, add 166.
| Weight | Age 25 | Age 40 | Age 55 | Age 70 |
|---|---|---|---|---|
| 130 lb | 1,336 | 1,261 | 1,186 | 1,111 |
| 150 lb | 1,426 | 1,351 | 1,276 | 1,201 |
| 170 lb | 1,517 | 1,442 | 1,367 | 1,292 |
| 190 lb | 1,608 | 1,533 | 1,458 | 1,383 |
| 210 lb | 1,698 | 1,623 | 1,548 | 1,473 |
| 230 lb | 1,789 | 1,714 | 1,639 | 1,564 |
Notice what the table shows and what it doesn’t. Moving from 130 to 230 pounds changes the result by about 450 calories; moving from age 25 to 70 changes it by about 225. Neither shift produces anything close to the swings promised by “metabolism reset” marketing.
Body fat sensitivity in Katch-McArdle
Maria at three body-fat estimates
Because the equation uses lean mass, an error in your body fat percentage moves the result directly. For Maria (170 lb, 77.1 kg), the lean mass at 32%, 38%, and 44% body fat is 52.4, 47.8, and 43.2 kg. That gives BMRs of about 1,503, 1,403, and 1,303 calories. A six-point error in body fat makes a 100-calorie difference.
Dan at three body-fat estimates
Dan is an illustrative 29-year-old man, 6 feet tall (72 inches), 190 pounds (86.2 kg). Mifflin-St Jeor gives him about 1,865 calories, and revised Harris-Benedict gives about 1,956. Katch-McArdle at 15%, 20%, and 25% body fat gives about 1,952, 1,859, and 1,766. At 20% body fat, Katch-McArdle lands almost on top of Mifflin-St Jeor. At 15%, it matches Harris-Benedict. At 25%, it’s about 100 calories below Mifflin-St Jeor.
| Person | Body fat assumed | Lean mass (kg) | Katch-McArdle (calories/day) | Mifflin-St Jeor for comparison |
|---|---|---|---|---|
| Maria (170 lb) | 32% | 52.4 | about 1,503 | about 1,452 |
| Maria (170 lb) | 38% | 47.8 | about 1,403 | about 1,452 |
| Maria (170 lb) | 44% | 43.2 | about 1,303 | about 1,452 |
| Dan (190 lb) | 15% | 73.3 | about 1,952 | about 1,865 |
| Dan (190 lb) | 20% | 68.9 | about 1,859 | about 1,865 |
| Dan (190 lb) | 25% | 64.6 | about 1,766 | about 1,865 |
How to Use a BMR Calculator Well: A Six-Step Process
A BMR calculator is quick to use and easy to misuse. The difference usually comes down to a handful of small habits: getting the inputs right, running more than one equation, and deciding in advance what you’ll do with the answer. Here’s the sequence in order, and then each step in detail.
- Measure your current weight and height accurately.
- Decide whether you have a trustworthy body-fat number (if not, skip lean-mass equations).
- Run Mifflin-St Jeor, and a second equation for comparison.
- Record the result as a range, along with the date and inputs.
- Add an activity estimate to turn BMR into a whole-day figure.
- Re-run after meaningful changes in weight, routine, or health.
Steps 1 and 2: Get accurate inputs
Weight and height
Weigh yourself first thing in the morning, after using the bathroom and before eating or drinking, on the same scale each time. Day-to-day weight can bounce by a few pounds for reasons unrelated to body fat, such as water, sodium, and what’s still in the digestive tract, so an average of three mornings gives a steadier input than a single reading. Measure height in bare feet standing against a wall, or use a height you recently had measured at a clinic. People often remember a height from their twenties; adults can lose a little height with age, and an inch matters about 16 calories.
Body fat: use it or skip it
Only enter body fat if you have a reasonably reliable number, such as from a recent clinical body-composition scan, and only for a calculator that uses it. A number from a bathroom scale or an app is a rough estimate, and, as the earlier sensitivity table showed, a few points of error shifts a Katch-McArdle result by dozens of calories. If you’re unsure, skip it. Mifflin-St Jeor doesn’t need body fat and has the stronger validation record among the common equations.
Steps 3 and 4: Run two equations and record a range
Running the numbers
Calculate Mifflin-St Jeor first, then revised Harris-Benedict (or Katch-McArdle if you have body fat). Don’t be surprised if the second comes out 50 to 150 calories higher. For the profiles above, the gap was 56, 101, and 144. A very large gap, say over 300 calories, is a signal to check your units and inputs again.
Writing it down
Record the date, the weight, height, and age you used, which equations you ran, and the resulting range. That one-line note makes it easy to see later whether a change in your plan is really due to a change in the numbers or just a different calculator. Try something like: “Oct 7: 170 lb, 65 in, age 38. Mifflin 1,452; Harris-Benedict 1,508; range 1,450 to 1,510.”
Steps 5 and 6: Decide what the number is for
Adding activity
BMR alone is not a daily calorie need. To get closer to a full-day figure, you add the cost of digesting food, exercise, and everyday movement, usually through an activity multiplier. The common multipliers, their weaknesses, and how to test the result against your own tracked data are covered in the TDEE calculator guide, and the step-by-step calculation for turning that into a weight-loss target is in how to calculate a calorie deficit. We don’t repeat those details here.
When to re-run the calculation
A reasonable schedule is to recalculate after every 10 pounds or so of weight change, after a major change in your routine (a new job, injury, or training program), and at least once a year because age is an input. Don’t recalculate weekly; scale noise will make the number look unstable when it isn’t.
How Accurate Is a BMR Calculator?
Every BMR calculator is a prediction, and a prediction has an error. The useful questions are how big that error is, which direction it tends to run, and who it’s least reliable for.
What the validation research found
Mifflin-St Jeor’s track record
The 2005 systematic review by Frankenfield, Roth-Yousey, and Compher compared four prediction equations (Harris-Benedict, Mifflin-St Jeor, Owen, and the World Health Organization, Food and Agriculture Organization, and United Nations University equation) against measured resting metabolic rate in healthy nonobese and obese adults. Mifflin-St Jeor predicted within 10% of the measured value in more people than any other equation in both groups, and had the narrowest error range. The review’s abstract doesn’t give a single percentage for how many people fell within that 10% band, and we don’t quote one.
The gaps in the evidence
The same review noted that older adults and U.S. ethnic minority groups were underrepresented in the development and validation of the equations, that no validation work had examined individual-level error for the WHO equation, and that noteworthy errors and limitations exist when equations are applied to individuals. Its authors suggested using clinical judgment about when to accept an estimate and when to measure resting metabolic rate directly. That’s a fair summary of where things stand: equations are useful on average, less certain for any one person, and least tested in the groups where a nutrition professional is most likely to be asked for help.
What a 10 percent error looks like in calories
The arithmetic on BMR itself
“Within 10%” sounds tight, but it’s worth translating into calories. For a person whose true BMR is 1,500 calories a day, a 10% miss is 150 calories either way. That’s meaningful, but it isn’t dramatic on its own.
How the error grows when you build a whole-day number
The problem is that BMR is the starting point for a larger calculation. If you multiply a BMR estimate by an activity factor of 1.4 to get a whole-day figure, a 150-calorie BMR error becomes about 210 calories of error in the daily total. Add some uncertainty in the activity multiplier itself, and the daily estimate can easily be off by 300 calories or more. That’s why we recommend tracking your own data over a few weeks rather than treating a formula’s output as final.
| Estimated BMR (calories/day) | 10% error on BMR | Range if the estimate is 10% off | Whole-day figure at 1.4 | 10% error carried into whole-day figure |
|---|---|---|---|---|
| 1,300 | ±130 | 1,170 to 1,430 | 1,820 | ±182 |
| 1,500 | ±150 | 1,350 to 1,650 | 2,100 | ±210 |
| 1,800 | ±180 | 1,620 to 1,980 | 2,520 | ±252 |
| 2,000 | ±200 | 1,800 to 2,200 | 2,800 | ±280 |
Why two similar people can have different true BMRs
Body composition and organ size
Two adults who are the same age, sex, height, and weight can differ in muscle, fat, and organ mass. From the tissue model described earlier, we know that organ size and lean mass drive much of resting energy use. A formula that only sees height and weight can’t tell them apart.
Measurement conditions
Even a measured value is not a fixed trait. The 2006 systematic review of RMR measurement conditions (Compher et al., Journal of the American Dietetic Association) found that eating, alcohol, nicotine, caffeine, and physical activity before a test can all affect results, and that the testing protocol itself matters. A measured RMR from a poorly prepared test may be less reliable than a good equation. Even in a well-run setting, a result is a snapshot of that morning, not a permanent label.
Measuring BMR Instead of Estimating It
If equations are estimates, can you simply measure your own resting metabolic rate? Yes, but with caveats about what’s accurate, what’s marketed as accurate, and whether the effort is worth it.
Indirect calorimetry: the lab standard
How it works
Indirect calorimetry estimates energy use by measuring the oxygen you breathe in and the carbon dioxide you breathe out. Because the body uses oxygen to turn food and stored fuel into energy, the amount consumed tells you how much energy is being used. You typically lie still for a short period while wearing a mask, mouthpiece, or ventilated hood connected to the analyzer. This is the kind of measurement used to build and test the prediction equations discussed earlier.
How the test is prepared and run
According to the 2006 systematic review by Compher and colleagues, which looked at conditions affecting RMR measurement in adults, people should refrain from eating, alcohol, nicotine, caffeine, and physical activity beforehand, with different recommended lead times for each. The review found that a rest of 10 to 20 minutes before measurement is appropriate, that a 10-minute test can be accurate if the first 5 minutes are discarded, and that the remaining 5 minutes should have a coefficient of variation (a measure of how much the readings bounce around) below 10%. Specific fasting and caffeine windows vary by facility, so follow the instructions you’re given rather than guessing.
Handheld devices, smart scales, and wearables
What the handheld evidence shows
Portable handheld indirect calorimeters are marketed for consumers and clinics. In a 2013 study in the Journal of Parenteral and Enteral Nutrition, Frankenfield and Coleman compared one handheld device against a standard open-circuit indirect calorimetry cart in 100 community-dwelling adults. The average values of the two devices were not significantly different, but agreement for individuals was poor: the handheld agreed with the standard only 43% of the time, tended to read higher, and had limits of agreement from −240 to +300 calories per day. The authors concluded that the handheld device’s measurements were not equivalent to standard indirect calorimetry. That was one device in one study, and technology changes, but it’s a useful reality check on the claim that a pocket device can replace a lab test.
Smart scales and fitness trackers
Many bathroom scales and wearables display a “BMR” figure. As far as we can tell from how these products are generally described, most calculate that figure from a prediction equation that uses your weight, height, age, and sex, sometimes with an estimate of body composition from a small electrical current, rather than measuring oxygen use. We didn’t find a validation study of specific consumer products to cite, so treat their numbers as a calculator result in a different package. A device that reports a BMR to the single calorie is not more accurate than one that rounds to the nearest 10.
| Method | What it does | What the evidence in this article says | Practical considerations |
|---|---|---|---|
| Prediction equation (online or by hand) | Estimates BMR from weight, height, age, sex | Mifflin-St Jeor most often within 10% of measured in a 2005 systematic review; individual errors can be noteworthy | Free and instant; accuracy varies by person |
| Lean-mass equation (Katch-McArdle) | Estimates BMR from lean body mass | Sensitive to body fat estimate (about 100 calories per 6 points in our examples) | Needs a reliable body-composition measurement |
| Lab indirect calorimetry | Measures oxygen use and carbon dioxide output at rest | Standard for measurement; conditions matter (2006 review) | Needs preparation, equipment, and trained staff; availability and cost vary |
| Handheld indirect calorimeter | Measures oxygen use with a portable device | One device in one study (100 adults) agreed with the lab cart only 43% of the time; limits of agreement −240 to +300 calories | Convenient; not shown to be interchangeable with a lab test |
| Smart scale or wearable “BMR” | Usually displays a formula result | No specific validation study found for this article | Treat as an equation estimate |
Is measuring worth it?
When a measurement can help
Measurement is mainly useful when the stakes or the uncertainty are high. A clinician or registered dietitian might order it for someone whose calculated numbers don’t fit their clinical course, for someone with a medical condition that alters energy use, or for someone in a supervised nutrition program where a precise starting estimate matters. The 2005 systematic review itself suggested that measuring RMR may be worthwhile for populations underrepresented in the validation work.
When it probably isn’t
For most people starting a weight-management plan, a measured BMR isn’t necessary, because even a perfect BMR doesn’t tell you the rest of your daily energy use, which is the larger source of uncertainty. Spending that effort on a few weeks of consistent food and weight tracking usually gives you a more useful number. If a measurement is offered and you’re curious, treat the result as one data point and an interesting piece of context, not as a verdict on your metabolism.
BMR and Your Calorie Target: What the Number Does and Doesn’t Tell You
This is where most of the confusion about BMR starts. Once you have a number, it’s tempting to treat it as a budget, a minimum, or a verdict. It’s none of those, and understanding why saves you from some common mistakes.
BMR is not a daily calorie budget
The parts BMR leaves out
Total daily energy use has four broad pieces: resting energy (BMR or RMR), the energy of digesting and processing food, planned exercise, and everyday movement such as walking, standing, and chores. BMR covers the first and leaves out the other three. The U.S. Food and Drug Administration notes that 2,000 calories a day is used as a general guide for nutrition advice, and that your needs may be higher or lower depending on your age, sex, height, weight, and physical activity level. In other words, even the agency’s own reference point is not a personal target.
A worked comparison
Take Maria again, with her Mifflin-St Jeor BMR of about 1,452 calories. If a desk-bound week puts her near a 1.2 multiplier, her whole-day estimate is about 1,742 calories (1,452 × 1.2). If she walks a lot and does regular workouts, a multiplier near 1.4 gives about 2,033 calories. Same BMR, a range of roughly 300 calories in the whole-day figure, simply from the activity guess. Her BMR didn’t change; her day did. We cover how to pick and test a multiplier in the TDEE guide.
Should you eat below your BMR?
Where the “never eat below your BMR” rule comes from
You’ll often read that you must never eat fewer calories than your BMR or your body will “go into starvation mode.” The rule sounds protective, and the underlying idea has a grain of sense: a very low intake that’s sustained for a long time can cause problems, including loss of lean mass and nutrient shortfalls. But as a rigid rule it falls apart. Because BMR is only part of whole-day energy use, a person can be in a modest deficit while eating above their BMR, and a very active person can eat below it without being in a large deficit. In the government weight-management sources we reviewed, including the CDC and NIDDK pages cited here, we did not find the rule stated as guidance.
What official sources do say
The Centers for Disease Control and Prevention (CDC) says that people who lose weight at a gradual, steady pace, about 1 to 2 pounds a week, are more likely to keep it off than people who lose weight more quickly. NIDDK says experts recommend an initial weight-loss goal of 5% to 10% of starting weight within 6 months. NIDDK’s Body Weight Planner, a calculator for adults 18 and older, notes that daily intake must stay at least 1,000 calories to meet nutritional targets, and that it isn’t for younger people or for pregnant or breastfeeding women. Those are the kinds of boundaries that matter: pace, supervision, and population, not a single formula output.
BMR in the bigger calorie-deficit picture
A deficit is measured against the whole day
A calorie deficit means eating less than you use over time. “Use” here means the whole-day total, not BMR alone. If you compare your intake to your BMR, you’ll misjudge the size of your deficit by the full cost of your activity and digestion. Our guide to the calorie deficit explains how the concept works, and the calculator guide walks through the arithmetic.
Why the classic math is only a rough guide
Many articles still repeat the “3,500 calories per pound” rule. In a 2011 paper in The Lancet, Hall and colleagues showed that this static rule overestimates weight loss because it ignores how the body adapts as weight falls. Their model found that half of the eventual weight change from a lasting change in intake takes about a year, and about 95% takes around three years. For anyone using a BMR-based plan, that means progress will usually be slower than the arithmetic suggests, and recalculating along the way is normal. It doesn’t mean the plan has failed. Our guide to weight loss plateaus explains what to do when the scale stalls.
Can You Change Your BMR? Muscle, Aging, Dieting, and Metabolic Adaptation
Few topics attract more hype than “boosting your metabolism.” The honest answer is that BMR can change, but within limits that are smaller than most claims suggest. What follows is what the evidence supports, with the numbers attached.
Strength training and muscle
What muscle adds at rest
Using the tissue model from earlier, muscle burns roughly 6 calories per pound per day at rest, versus about 2 calories for fat. So gaining 5 pounds of muscle would, on those numbers, add on the order of 30 calories a day. That’s not nothing, but it’s small. Muscle matters for strength, function, and keeping the weight you lose, even though its direct effect on BMR is modest.
What trials show
A 2020 systematic review and meta-analysis in the Journal of Sports Sciences (MacKenzie-Shalders and colleagues) pooled 18 studies of exercise interventions and resting metabolic rate. Resistance exercise was associated with a mean increase of about 96 calories per day compared with controls. Aerobic exercise alone (about 82 calories a day) and combined aerobic plus resistance exercise (about 75 calories a day) did not produce a statistically significant increase. The authors noted heterogeneous methods and a high risk of bias in the included studies, which limits confidence in these figures. Taken together: strength training may nudge resting energy up, by something on the order of 100 calories a day, and it has other well-established benefits. You can read more in our beginner’s guide to strength training for weight loss and on losing fat and building muscle at the same time.
Aging and lean mass
What the large dataset shows
As described earlier, the Pontzer team’s analysis found that fat-free-mass-adjusted energy expenditure was stable from roughly 20 to 60 and declined after about 60. That fits a picture where the biggest driver of decline in later years is the loss of metabolically active tissue and activity rather than a sudden mid-life switch.
What you can influence
Nobody can stop aging, but you can influence how much lean mass you carry. Regular resistance training, adequate protein, and staying generally active all support muscle. Our guide to how much protein you need to lose weight covers the nutrition side. If you’re over 60 and concerned about unintentional weight loss or muscle loss, that’s worth raising with your clinician; a calorie calculator can’t distinguish healthy from concerning changes.
Dieting and metabolic adaptation
What “metabolic adaptation” means
Metabolic adaptation (sometimes called adaptive thermogenesis) is when resting energy use falls by more than you’d predict from the loss of weight and lean tissue alone. A frequently cited study of this is Fothergill and colleagues, published in Obesity in 2016, which followed 14 contestants from a televised weight-loss competition. As reported in a news summary of the paper, their average resting metabolic rate was about 2,607 calories per day at the start, 1,996 at the end of the 30-week competition, and 1,903 six years later, even though most had regained much of the weight. The authors concluded that the metabolic slowdown persisted.
Why the study should be read with care
This was a small group of 14 people who lost an extraordinary amount of weight (an average of about 58 kilograms, or roughly 128 pounds) under extreme conditions. It can’t be generalized to someone losing 15 pounds over several months. Results from the broader literature on how large the adaptation is and how long it lasts are mixed, and we haven’t assessed them here. The practical lesson is a modest one: as weight falls, your resting energy needs fall too, partly because of the smaller body and possibly because of adaptation, so plans should be revisited and not locked in. A gradual pace and enough protein and strength training to protect muscle are sensible hedges.
“Metabolism-boosting” foods, supplements, and tricks
What’s realistic
Spicy foods, green tea, cold exposure, and various supplements are regularly promoted as metabolism boosters. We found no major government or clinical guideline recommending any of them as a weight-loss strategy, and whatever effects have been reported are typically small, short-lived, or from small trials. If a claim can’t tell you how many calories per day it’s worth, over what period, in which kind of people, it isn’t a claim you can use. For scale, remember that even a verified 100-calorie-a-day change is a small fraction of a typical day’s energy use.
How to evaluate a claim
Ask four questions. How big is the effect, in calories per day? Was it studied in people like you, and for how long? Was it compared with a control group? And who funded it? Be especially wary of anything promising to “reset” or “repair” a metabolism, to deliver rapid fat loss, or to work without any change in eating or activity. Supplements can also interact with medications; if you take any prescription, check with a pharmacist or clinician first.
Who Should Be Cautious With a BMR Calculator
Prediction equations were built from measurements in healthy adults, so they work best for people like those in the original samples. For everyone else, they range from “rough guide” to “not appropriate.” Knowing which group you’re in is part of using the tool responsibly.
Life stages and histories where calculators don’t apply
Children, teens, pregnancy, and breastfeeding
The adult equations in this article were developed for adults. NIDDK’s Body Weight Planner states plainly that it’s intended for adults 18 and older and isn’t for younger people or for pregnant or breastfeeding women. Children and teens are still growing, and their energy needs reflect growth, so weight-loss calorie targets for them should come from a pediatrician or registered dietitian. Pregnancy and breastfeeding have their own energy needs and guidance, which a clinician should provide.
A history of disordered eating
If you have, or have had, an eating disorder, or if counting calories and chasing a number tends to push you into restriction, bingeing, or intense guilt, a BMR calculator isn’t a neutral tool. The National Institute of Mental Health (NIMH) describes eating disorders as serious illnesses that can be life-threatening, and notes that fixation on weight loss, body weight or shape, and controlling food intake can be signs of one. NIMH also says eating disorders can be treated, and that early detection and treatment matter. If this describes you, speak with a clinician or an eating-disorder specialist before using calorie targets of any kind. In the U.S., the 988 Suicide and Crisis Lifeline and findtreatment.gov are among the resources NIMH lists for finding help.
Medical conditions and medications
Thyroid and other hormonal or chronic conditions
Thyroid disease, diabetes, kidney or heart disease, and other chronic conditions can change energy use, appetite, or the safe range for calorie and nutrient intake. NIDDK describes thyroid hormones as controlling the way the body uses energy, and that is exactly the type of factor a four-input equation cannot see. If you have a diagnosed condition, ask your clinician what calorie and nutrition targets are appropriate before relying on a calculated number.
Medications that affect appetite, weight, or energy use
Some prescription medications can change appetite, fluid balance, or weight. We don’t list drugs or effects here because they vary by person, and no calculator accounts for them. If you take a medication that your care team links to weight or appetite changes, include them in the conversation, and never change a prescription based on a calculated number. For people using prescription weight-management medicines, our patient-friendly guide to GLP-1 medications covers why calorie and nutrition planning should be coordinated with the prescriber.
Bodies the equations fit poorly
Highly muscular people and athletes
An equation based on weight alone can’t tell muscle from fat, so it may underestimate resting energy in a very muscular person whose lean mass is high for their weight. A lean-mass equation can help if the body composition number is reliable. Athletes also face a different risk: eating too little for their training load. If you train hard and your plan includes a calorie deficit, a sports dietitian can help balance both.
Very large bodies, very small bodies, and older adults
The 2005 systematic review noted that errors for individuals can be noteworthy, and that older adults and some ethnic groups were underrepresented in the data behind the equations. We’d add, as editorial judgment and not as a cited finding, that the further a person is from the typical sample on height, weight, or age, the more reasonable it is to treat a calculated BMR as a rough guide and to consider professional help.
| Situation | Why a calculator may mislead | Who to ask |
|---|---|---|
| Under 18 | Adult equations; growth needs are not in the formula | Pediatrician or registered dietitian |
| Pregnant or breastfeeding | Energy needs rise for reasons the formula can’t see | Obstetric or primary care clinician |
| Eating-disorder history | Numeric targets can trigger harmful patterns | Eating-disorder specialist or clinician |
| Thyroid disease, diabetes, kidney or heart disease | Condition or treatment can change energy use and safe intake | Treating clinician; registered dietitian |
| Weight-affecting medications | Appetite and energy effects are not captured | Prescribing clinician or pharmacist |
| Very muscular or highly trained | Weight-based equations can misjudge lean mass | Sports dietitian |
| Older adults | Fewer older adults in validation data; risk of muscle loss | Clinician or registered dietitian |
Common BMR Calculator Mistakes and How to Fix Them
Most calculator problems come from a short list of repeat offenders. The good news is that they’re easy to catch once you know what to look for.
Input and interpretation mistakes
Garbled inputs
The usual errors are entering pounds in a kilogram box, inches in a centimeter box, or a height of “5.5” when you meant 5 feet 5 inches (5.5 feet is 5 feet 6 inches, and 5.5 inches is a very different number). Another is using an old weight or an age you haven’t updated. Re-enter the numbers slowly and check the units before blaming the formula.
Treating the number as a rule
The second class of mistakes is interpretive. People treat BMR as a calorie floor, as proof that their metabolism is “slow,” or as a quota to hit every day. None of those readings is supported by what the number measures. Your BMR is an estimate of resting energy use; what you do with it should depend on the full-day picture, your health, and your trajectory.
| Mistake | What it causes | Fix |
|---|---|---|
| Mixing pounds and kilograms, or inches and centimeters | Wildly high or low result | Check units; compare with a range of about 1,100 to 2,200 for most adults |
| Using BMR as the daily calorie target | Underestimates needs, can lead to overly aggressive plans | Add activity (see the TDEE guide) and confirm with tracked data |
| Trusting a body-fat guess in Katch-McArdle | A few points of error shift the result by dozens of calories | Use Mifflin-St Jeor unless you have a reliable measurement |
| Comparing different calculators as if they should match | Confusion over 50 to 150 calorie gaps | Treat the gap as a range |
| Believing a smart-scale BMR is measured | False precision | Treat it as an equation result |
| Never recalculating | An outdated number after weight change | Recalculate after about 10 pounds of change |
| Reading a low BMR as a “broken” metabolism | Unnecessary worry and risky “fixes” | Remember size and lean mass drive BMR; see a clinician if symptoms concern you |
If this, then that: troubleshooting
If your two equations differ by a lot
A gap of 50 to 150 calories is normal. If it’s 300 or more, first check units and inputs. If those are right, the explanation is probably the body-fat input in a lean-mass equation. Fall back to Mifflin-St Jeor and carry the range.
If the result doesn’t fit your real life
Suppose a calculator says you burn 1,300 calories at rest, but you’ve been eating roughly 1,800 a day and your weight has been flat for a month. That isn’t a contradiction. It means your whole-day needs are above your resting number, which is normal. The real test of any estimate is what happens to your weight over several weeks of consistent intake. The tracking method for that is in the TDEE guide.
If your weight loss stalls
A stall is rarely a BMR problem. As described earlier, resting needs fall as weight falls, and your original calorie target may now be closer to maintenance. Re-run your numbers at the new weight, review tracking accuracy, and see our guide on why plateaus happen and what to do. If you’re losing quickly beyond the pace discussed in how much weight you can safely lose in a month, or you feel unwell, talk to a clinician.
A Two-Week Plan to Put Your BMR Estimate to Work
Knowing the theory only helps if it changes what you do. Here’s a simple, low-pressure two-week routine that uses your BMR estimate as a starting point and your own data as the check. It’s not a diet. It’s a way to find out how your real days compare with the numbers.
Week 1: Set up and gather data
Day-by-day schedule
| When | What to do | Time needed |
|---|---|---|
| Day 1 | Measure weight and height; run Mifflin-St Jeor and one other equation; write down the range and the date | About 15 minutes |
| Day 2 | Decide on an activity estimate using the conservative end of the choices in the TDEE guide; note it down | About 10 minutes |
| Days 3 to 7 | Weigh most mornings under the same conditions; keep eating roughly as you normally do and log it honestly | A few minutes a day |
| Day 7 | Calculate the weekly average weight and the weekly average intake | About 10 minutes |
| Days 8 to 13 | Repeat the same routine; keep the pattern of meals and activity steady | A few minutes a day |
| Day 14 | Compare weeks one and two; decide whether to adjust the activity estimate or the calorie plan | About 20 minutes |
What to log and what to ignore
Log what you eat and drink, your morning weight, and a quick note on anything unusual such as travel, illness, a big change in sleep, or a very different workout week. Ignore single-day weight swings, since water and digestive contents alone can move the scale by a few pounds. The goal is two clean weekly averages, not a perfect daily record.
Week 2: Review and decide
What to look for
If your weekly average weight stayed about the same across both weeks while your intake was steady, your average intake is a decent estimate of your maintenance calories, regardless of what the formula said. If your weight trended up or down, the formula and your guess about activity were off in one direction or the other. Use the direction, not the exact amount, to adjust your estimate. Two weeks is short, so extend to four if your routine wasn’t steady. The calculation itself is covered in the TDEE guide.
When to ask a professional
Reach out to a clinician or registered dietitian if you notice rapid, unexplained weight changes, persistent fatigue or feeling cold, dizziness, changes in your menstrual cycle, or a growing preoccupation with food or numbers. Those are things a calculator can’t evaluate, and some of them can’t wait for a longer tracking period.
A one-page checklist
Before you start
- Confirm that a calculator is appropriate for you (adult, not pregnant or breastfeeding, no eating-disorder history, no medical condition that changes energy needs without guidance).
- Measure weight and height; check units.
- Run at least two equations and save the range.
- Choose a conservative activity estimate for the whole-day number.
After two weeks
- Compare weekly average weights and average intake.
- Adjust the estimate based on the direction of change, not on one day.
- Plan a recalculation for roughly every 10 pounds of change.
- Write down any questions to bring to a clinician or dietitian.
Frequently Asked Questions About BMR Calculators
Basics and definitions
Is BMR the same thing as “metabolism”?
Not quite. Metabolism is the broad term for all the chemical reactions that keep you alive and functioning. BMR is one measurement within it: the energy used at complete rest. Digestion, movement, and exercise are part of your overall metabolism but are outside the BMR.
What is a “normal” BMR?
There’s no single normal. In our Mifflin-St Jeor grid, a woman 5 feet 5 inches tall ranged from about 1,100 to about 1,800 calories a day depending on weight and age, and for men of the same size and age the result is 166 higher. A “normal” BMR is the one that fits your body size and composition, and a calculator or measurement is the only way to see how yours compares with a prediction.
Is BMR the number of calories I’d burn if I stayed in bed all day?
It’s close to the idea, but not exact. BMR assumes strict rest and a fasted state. If you stayed in bed, you’d still use extra energy for digesting meals and for small movements, so the real total would be somewhat higher than BMR.
Does a higher BMR mean I’m healthier or fitter?
No. A larger body generally has a higher BMR simply because there’s more tissue to maintain, and BMR isn’t a health score. Fitness, blood pressure, blood sugar, and other markers tell you about health; BMR tells you about resting energy use.
Accuracy and measurement
Which BMR calculator is the most accurate?
No website can be more accurate than the equation behind it. Calculators that use Mifflin-St Jeor are a sensible choice based on the 2005 systematic review, and if a site doesn’t say which equation it uses, that’s a reason to be cautious. Whatever you use, expect the result to be an estimate within a range.
Why does my BMR differ from site to site?
Different equations, different rounding, and sometimes different input assumptions (such as how body fat is handled). Differences of 50 to 150 calories between Mifflin-St Jeor and Harris-Benedict are typical, as the worked examples show. Treat them as a range.
Can my smartwatch or smart scale measure my BMR?
Based on how these products are generally described, most calculate BMR from an equation rather than measuring oxygen use, so the number is an estimate. We found no validation study for specific consumer products to cite. See the measurement table above for how the methods compare.
How would I get a measured BMR, and is it worth it?
Indirect calorimetry is done in clinics, universities, and some fitness or medical facilities; availability, cost, and whether insurance covers it vary, so ask your clinician. For most people trying to manage weight, a few weeks of tracking provides more useful information than a measured resting rate would.
Using BMR for weight goals
Should I eat my BMR number to lose weight?
BMR isn’t designed to be a calorie target. Your daily target should be based on your whole-day energy use, your health, and your pace of change, ideally with guidance if you have a medical condition. We don’t prescribe a number; see the safety note earlier, and the guides on calculating a deficit and on safe weight loss.
Can I use my BMR to predict how much weight I’ll lose?
No. BMR is one component of energy use, and the body’s adaptation as weight falls means that real-world results differ from simple calorie arithmetic. Hall and colleagues’ 2011 analysis showed why the 3,500-calorie rule overestimates weight loss. Individual results vary, and no calculator can promise a pace.
Does BMR matter if I’m taking a GLP-1 medication?
Calorie and nutrition needs on prescription weight-management medication should be set with the prescribing clinician, who knows your health history and how the drug is affecting your appetite and intake. A calculator can’t account for that. Our GLP-1 guide explains the broader picture.
When should I talk with a professional instead of using a calculator?
If you’re under 18, pregnant or breastfeeding, have a medical condition or take medicines that affect weight, have ever had an eating disorder, are an older adult worried about unintended weight or muscle loss, or if numbers and food rules cause you distress, a professional’s input is more valuable than any calculator result. Our guides for women and men include more on sex-specific considerations.
Bottom Line
What to remember
The core points
BMR is the energy your body uses at complete rest, driven mostly by organ and lean tissue mass. A BMR calculator predicts it from your weight, height, age, and sex using an equation such as Mifflin-St Jeor, which has the best record among the common ones, but individual errors can be noteworthy. The number is a starting point, not a calorie target, a floor, or a verdict on your metabolism. It changes modestly with weight, lean mass, and older age, and it isn’t something supplements or tricks reliably reset.
What to do next
Run two equations, record a range, add a conservative activity estimate if you want a whole-day figure, and check it against two to four weeks of your own food and weight records. Recalculate after roughly 10 pounds of change. If you belong to a group where calculators don’t apply, or if numbers make you anxious, start with a clinician or registered dietitian. For the bigger picture, return to how to lose weight safely.
Editorial and medical-review note
Scope of this article
This article is educational and does not provide individualized medical or nutrition advice. It does not diagnose conditions, prescribe diets, or recommend changes to any medication. Examples use illustrative people and rounded arithmetic that we calculated ourselves.
Fact-checking and review
The content was fact-checked against the sources listed below as of October 7, 2026, and is flagged for qualified clinical review before publication. If you have a medical condition, take medications, are pregnant or breastfeeding, or have a history of disordered eating, discuss calorie targets with your clinician or a registered dietitian.
Sources
Primary sources (government and clinical guidance)
U.S. government pages
- U.S. Food and Drug Administration. Calories on the Nutrition Facts Label.
- Centers for Disease Control and Prevention. Steps for Losing Weight.
- National Institute of Diabetes and Digestive and Kidney Diseases. Choosing a Safe and Successful Weight-Loss Program.
- National Institute of Diabetes and Digestive and Kidney Diseases. Hypothyroidism (Underactive Thyroid).
- National Institute of Mental Health. Eating Disorders.
Tools
- National Institute of Diabetes and Digestive and Kidney Diseases. Body Weight Planner.
Research and supporting literature
Resting energy: equations, tissues, and measurement
- Mifflin MD, St Jeor ST, Hill LA, Scott BJ, Daugherty SA, Koh YO. A new predictive equation for resting energy expenditure in healthy individuals. American Journal of Clinical Nutrition, 1990.
- Frankenfield D, Roth-Yousey L, Compher C. Comparison of predictive equations for resting metabolic rate in healthy nonobese and obese adults: a systematic review. Journal of the American Dietetic Association, 2005.
- Compher C, Frankenfield D, Keim N, Roth-Yousey L. Best practice methods to apply to measurement of resting metabolic rate in adults: a systematic review. Journal of the American Dietetic Association, 2006.
- Frankenfield DC, Coleman A. An evaluation of a handheld indirect calorimeter against a standard indirect calorimeter. Journal of Parenteral and Enteral Nutrition, 2013.
- Wang Z, et al. Specific metabolic rates of major organs and tissues across adulthood: evaluation by mechanistic model of resting energy expenditure (values read from the BioNumbers database entry). American Journal of Clinical Nutrition, 2010.
- Benton MJ, Hutchins AM, Dawes JJ. Effect of menstrual cycle on resting metabolism: a systematic review and meta-analysis. PLOS ONE, 2020.
- Harris-Benedict equations as revised by Roza and Shizgal, American Journal of Clinical Nutrition, 1984, and the Katch-McArdle formula as commonly published: coefficients were cross-checked against a secondary reference, and the original papers were not opened.
Energy balance, aging, exercise, and adaptation
- Hall KD, et al. Quantification of the effect of energy imbalance on bodyweight. The Lancet, 2011.
- Pontzer H, et al. Daily energy expenditure through the human life course. Science, 2021.
- MacKenzie-Shalders K, Kelly JT, So D, Coffey VG, Byrne NM. The effect of exercise interventions on resting metabolic rate: a systematic review and meta-analysis. Journal of Sports Sciences, 2020.
- Fothergill E, et al. Persistent metabolic adaptation 6 years after “The Biggest Loser” competition. Obesity, 2016. Figures were read from a Healio news summary; the paper itself was not opened.

